
Are you unsure whether your projects are on track until it is too late?
Do you often struggle to keep project costs under control?
Are you finding it difficult to track project scope changes?
If you are nodding yes, then you are not alone. Many project managers face similar challenges due to a lack of visibility into project performance. This is where tracking project metrics becomes necessary. Clear and well-defined metrics provide a structured, data-driven approach to evaluate project progress and ensure alignment with overarching goals.
Moreover, project performance metrics enable managers to quantify success across key areas such as cost, scope, and resources. In addition, regular performance checks help identify potential challenges early on and ensure that the project does not get derailed.
In this article, we will explore project metrics, their importance, types, and best practices to help you maximize their impact on project success.

What are Project Metrics?
Project metrics are quantifiable measurements that help track progress and assess performance. These metrics help managers monitor key project elements such as cost, Time, scope, quality, and resources. They also allow teams to gauge planned vs. actual progress, take corrective actions to minimize deviations, and keep projects on schedule.
Moreover, metrics should be specific and relevant to the project objectives. For instance, in an IT project focused on maintaining a reliable and cost-efficient infrastructure, the Cost Performance Index (CPI) could be a key metric that helps assess financial efficiency.
In contrast, for a time-sensitive cloud migration project, a metric like Schedule Variance (SV) is more apt as it helps track project progress against the planned timeline. Thus, selecting the right metrics as benchmarks is crucial because they help project managers facilitate continuous improvement and ensure successful delivery.

Now that we know project metrics, let’s explore their importance.
Importance of Project Metrics
Project metrics are essential for measuring the success and efficiency of a project. They provide quantifiable data that helps project managers track progress, identify potential risks, and make informed decisions. Without clear metrics, teams may struggle to assess whether they meet objectives, stay within budget, or adhere to pre-defined timelines.
Besides, project metrics enhance accountability and transparency. When key stakeholders have access to real-time data on project performance, they can provide timely feedback and ask for necessary adjustments. This visibility ensures that the team executes the project as per the stakeholders’ expectations.
Lastly, project metrics enable organizations to set benchmarks against industry standards or previous internal projects. Therefore, it helps improve workflows, resource utilization, and performance of future projects.
In a nutshell, a project management metric allows you to:
- Analyze the overall health of the project.
- Determine the critical factors that need attention.
- Evaluate the current status and make informed decisions.
- Evolve, adapt, and forecast better during uncertainties.
Now that we have established the importance of project metrics, let’s understand how they differ from KPIs
Read More: Top 15 Operational Metrics That a Business Should Monitor
Difference Between Project Metrics vs. Project KPIs
Project metrics and KPIs are essential for tracking performance but serve different purposes. The key differences between them are:
| Aspect | Project Metrics | Project KPIs |
|---|---|---|
| Definition | Quantifiable measures that track project performance and progress. | Key indicators that measure project success in relation to business goals. |
| Purpose | Monitor operational efficiency and ensure tasks are on track. | Assess whether the project is achieving key business objectives. |
| Focus | Looks at past and present project performance. | Focuses on future outcomes and long-term success. |
| Scope | Specific to a single project and its activities. | Applicable across multiple projects or the entire organization. |
| Timeframe | Tracked in real-time or at regular intervals. | It has a set timeframe (e.g., quarterly, or yearly). |
| Examples | Cost variance, schedule variance, task completion rate. | ROI, customer satisfaction score, budget adherence. |
| Usage | Used by project managers for day-to-day decision-making. | Used by executives and stakeholders for strategic planning. |
| Actionability | May not always require immediate action. | Requires action if performance is off track. |
| Relation | Every KPI is a metric, but not every metric is a KPI. | KPIs are a select set of metrics that are crucial for project success. |
As we know what project metrics and KPIs are, let’s go through the different types of metrics.
Read More: Employee Retention KPIs: What are They, and Why Tracking Them is Crucial for Firms?
Types of Project Metrics
There are different types of metrics that focus on various aspects of project performance. Some of the most critical ones that every project manager must track are as follows:
Schedule Metrics
Schedule metrics measure how well a project follows its planned timeline. These measurements help project managers track progress, identify delays, and ensure timely completion. By analyzing these metrics, managers can make informed decisions about project schedules, adjust plans if needed, and keep them on track.
Actual Schedule Performance (ASP)
This metric can be used to evaluate the project’s actual progress compared to the planned schedule. If ASP > 1, the task took more time than planned; if ASP <1, the task was completed in less time than planned. Meanwhile, if ASP = 1, the task was completed as per the schedule. Thus, tracking ASP allows project managers to make timely adjustments to meet deadlines effectively.
The formula to calculate ASP is:
| ASP = EV / PV |
|---|
Here, EV stands for Earned Value, and PV for Planned Value.
Schedule Variance (SV)
It helps managers understand if a project is ahead or behind its planned schedule. A positive SV indicates progress ahead of schedule, and a negative SV implies delays. So, tracking this metric allows managers to take corrective actions such as reallocating resources, adjusting project timelines, or streamlining workflows to avoid project disruptions.
The formula to calculate SV is:
| SV = EV – PV |
|---|
Here, EV stands for Earned Value, and PV for Planned Value.
Schedule Performance Index (SPI)
This metric can be used to measure the ratio between earned and planned values. A value above 1 means the project is ahead, and a value below 1 signals delay. Hence, tracking SPI helps project managers refine workflows and improve overall time efficiency.
The formula to calculate SPI is:
| SPI = EV / PV |
|---|
Here, EV stands for Earned Value, and PV for Planned Value.
Read More: What is Resource Scheduling? How to Schedule Resources for Projects Efficiently?
Cost-Related Metrics
Cost-related metrics help managers monitor financial performance and maintain control over project budgets. These metrics offer valuable insights into spending trends, cost efficiency, and budget variances, enabling teams to identify potential financial risks early. Thus, it helps organizations improve resource allocation, control expenses, and enhance overall project profitability.
Actual Cost Performance (ACP)
This metric helps track the total expenditure for completed work within a specific period. It allows project managers to assess financial progress, compare actual spending with the project budget, and identify cost overruns. Thereby, monitoring ACP ensures better financial control and informed decision-making.
The formula to calculate Actual Cost Performance is:
| ACP = Sum of Actual Costs Incurred |
|---|
Cost Variance (CV)
It measures the difference between planned and actual costs, which helps project managers track financial performance. A negative CV signals overspending, requiring corrective actions, while a positive CV indicates cost savings. However, regular monitoring ensures better budget control and prevents financial issues.
The formula to calculate Cost Variance is:
| CV = EV – AC |
|---|
Here, EV stands for Earned Value, and AC for Actual Cost.
Cost Performance Index (CPI)
It measures cost efficiency by comparing earned value to actual costs. A CPI above 1 indicates the project is under budget, while a CPI below 1 implies overspending. So, tracking CPI helps managers optimize financial performance and control expenses effectively.
The formula to calculate the Cost Performance Index is:
| CPI = EV / AC |
|---|
Here, EV stands for Earned Value, and AC for Actual Cost.
Return on Investment (ROI)
This metric helps measure a project’s profit compared to its cost, expressed as a percentage. A high ROI indicates high profitability, while a low ROI suggests the need for cost or strategy adjustments. It helps evaluate financial gains, justify investments, and optimize resource allocation for better profitability.
The formula to calculate Return on Investment is:
| ROI = Net Profit × 100/Cost of Investment |
|---|
Read More: What is Earned Value Management, and How to Measure it for Project Success?
Quality-Related Metrics
Quality-related metrics measure the effectiveness, reliability, and compliance of deliverables to ensure they meet predefined standards. By tracking these metrics, they can identify quality issues and take corrective action to address them. Moreover, implementing quality metrics leads to better decision-making, continuous improvement, and elevated stakeholder satisfaction.
Defect Density
It helps assess product quality by measuring the number of defects per unit of deliverables over a specific period. A lower defect density indicates better quality and reliability, whereas a higher one means quality issues that need attention. So, tracking this metric allows managers to identify problem areas and improve project outcomes.
The formula to calculate Defect Density is:
| Defect Density = Total Defects / Size of the Product |
|---|
Customer Satisfaction Score (CSAT)
This score helps businesses understand how happy customers are with their products or services. A high CSAT indicates customer approval, while a low score points to areas needing improvement. Tracking CSAT allows companies to enhance customer experience and ensure long-term business relations.
The formula to calculate the Customer Satisfaction Score is:
| CSAT = (Number of Positive Responses / Total Number of Responses) × 100 |
|---|
Reward Rate
It evaluates the effectiveness of customer engagement initiatives by measuring how often rewards are redeemed. A high reward rate indicates that customers find value in the incentives, and a low rate suggests the need to refine the reward system to boost engagement.
The formula to calculate the Reward Rate is:
| Reward Rate = Number of Rewards Redeemed × 100 / Number of Rewards Issued |
|---|
First-Pass Yield (FPY)
The percentage of products that meet quality standards without requiring rework or corrections is measured using this metric. A high FPY implies an efficient process with minimal waste, while a low FPY indicates quality issues that may lead to higher costs and delays. Hence, measuring FPY helps reduce waste and improve product quality.
The formula to calculate FPY is:
| FPY = Quality Units / Total Units Produced |
|---|
Productivity Metrics
Measurements used to assess employee performance and efficiency are called productivity metrics. They provide insights into how well resources are utilized to achieve company goals. By tracking these metrics, businesses can identify areas for improvement, boost resource utilization, and optimize overall performance.
Resource Utilization Rate
It measures how effectively available resources are used for billable work. A higher rate indicates efficient allocation and a lower rate implies underutilization. Tracking this metric helps managers optimize workload distribution, improve efficiency, and ensure balanced resource management in projects.
The formula to calculate the Resource Utilization Rate is:
| Resource Utilization Rate = (Used Hours / Total Hours) × 100 |
|---|
Task Completion Rate
This metric helps measure the percentage of assigned tasks completed within a set timeframe. A high TCR reflects high productivity and efficiency, while a low rate may indicate delays or resource issues. Therefore, tracking TCR helps improve workflow and optimize task management.
The formula to calculate the Task Completion Rate is:
| Task Completion Rate = (Number of Completed Tasks / Total Number of Tasks) × 100 |
|---|
Effort Variance
It measures the difference between planned and actual effort in project tasks. It is calculated by subtracting planned effort from actual effort. Tracking effort variance project metrics helps identify gaps between planned and actual work, allowing better resource allocation and timely adjustments.
The formula to calculate Effort Variance is:
| Effort Variance = AE – PE |
|---|
Here, AE stands for Actual Effort, and PE for Planned Effort.
Read More: How to Track Employee Productivity? 7 Effective Ways
Scope & Change Management Metrics
These metrics are essential tools for managers to assess and track project scope and the impact of scope changes. They help measure the frequency, cost, and time effects of scope changes to ensure effective adjustments and project delivery when needed.
Scope Creep Percentage
This metric measures the percentage of unplanned changes or additions to a project’s original scope. By tracking this project metric, managers can identify the impact of scope creep, control its effects, and keep the project within its original boundaries and objectives.
The formula to calculate Scope Creep Percentage is:
| Scope Creep Percentage = Total Change in Scope – Approved Changes × 100 / Original Scope |
|---|
Read More: What is a Project Scope? Benefits, Best Practices, and Steps to Create an Effective One
Change Request Rate
Project managers use this metric to measure the percentage of approved changes in a project scope. A high rate indicates smooth management and adaptability, whereas a low rate suggests inefficiencies. Tracking this metric helps improve project control and customer satisfaction.
The formula to calculate the Change Request Rate is:
| Change Request Rate = (Number of Approved Change Requests / Total Number of Change Requests) × 100 |
|---|
Risk Management Metrics
Risk management metrics enable project managers to identify, assess, and mitigate potential risks throughout the project lifecycle. They can develop strategies, make informed decisions, and improve risk management by measuring risk factors. Hence, these metrics are crucial for minimizing uncertainty and ensuring long-term business success.
Risk Impact
This metric measures the potential consequences of risks on project goals. It also helps identify which risks are most critical and need immediate attention. This way, organizations can prioritize actions and create effective strategies to mitigate adverse effects.
The formula to calculate Risk Impact is:
| Risk Impact = Probability of Risk × Consequence of Risk |
|---|
Risk Resolution Rate
This rate indicates how effectively identified risks are addressed. A high rate shows that risks are being resolved on Time without project disruptions, and a low rate suggests delays, increased costs, and potential damage to the organization’s reputation. Monitoring this project metric helps improve risk strategies to ensure smoother operations.
The formula for the Risk Resolution Rate is:
| Risk Resolution Rate = (Number of Resolved Risks/ Total Number of Identified Risks) × 100 |
|---|
Issue Resolution Time
It measures the total time taken to resolve a customer issue, from initial contact to final resolution. A shorter resolution time indicates an efficient support process, while longer resolution times can negatively impact customer satisfaction and loyalty. Tracking this metric helps optimize support processes and enhance customer satisfaction.
The formula to calculate Issue Resolution Time is:
| Issue Resolution Time = Total Time Taken to Resolve Issues / Total Number of Issues Resolved |
|---|
Read More: Risk Matrix in Project Management: An Ultimate Guide
Stakeholder & Communication Metrics
Project managers use stakeholder metrics to evaluate stakeholder performance, satisfaction, and engagement. Communication metrics, on the other hand, track how effective communication efforts are within an organization. Measuring them helps identify issues, improve management strategies, and strengthen relationships.
Stakeholder Engagement Score
This score indicates the level of interaction and collaboration with stakeholders throughout a project’s lifespan. Tracking this score helps organizations assess engagement effectiveness, improve communication strategies, and align stakeholder expectations with business goals for long-term success.
The formula to calculate the Stakeholder Engagement Score is:
| Stakeholder Engagement Score = Number of Engaged Stakeholders × 100 / Total Stakeholders |
|---|
Communication Response Time
This project metric helps measure how quickly a team responds to a customer’s inquiry. Quick response times improve client satisfaction and trust, while slow responses can lead to frustration and lost opportunities. Therefore, monitoring this helps enhance service quality and customer relationships.
The formula to calculate Communication Response Time is:
| Communication Response Time = Time Taken to Respond to Enquiries / Total Number of Inquiries |
|---|
Read More: Who are Project Stakeholders? 7 Effective Ways to Manage Them
Having gone through the different types of metrics, let’s discuss how to choose the correct project metrics.
How to Select the Right Project Metrics?
Selecting the right project metrics for effective tracking and project performance evaluation. is crucial. The following factors will help identify the most relevant metrics that align with project objectives:
Understand Project Objectives and Goals
A clear understanding of project objectives and goals is crucial for selecting the right metrics. This helps you define the key success criteria for the project (for example, timely delivery, adhering to budget, or product quality). It is also essential to determine if there are any stakeholders’ expectations that must be met. Well-defined goals provide a roadmap for tracking progress and measuring project success effectively.
Consider Project Scope and Complexity
It is essential to consider a project’s scope and complexity to determine the right metrics for it. Complex projects require detailed metrics to track various attributes. Therefore, the scope should be established to ensure better project planning, accurate progress evaluation, and overall success.
Review Industry Standards and Best Practices
Studying industry standards and best practices helps choose relevant project metrics that are widely accepted. Standard metrics are tried and tested, ensuring that you measure the right aspects of performance. In addition, it is important to choose metrics that are specific to your industry. For example, the marketing team may focus on campaign performance, while software engineers would measure defect rates.
Collaborate with the Project Team
Engaging the project team and stakeholders in metric selection ensures alignment with project goals and operational realities. Moreover, team members offer diverse perspectives based on their expertise to help identify relevant performance indicators. For this, you can conduct brainstorming sessions and ensure that selected project metrics are meaningful to everyone involved.
Read More: 7 Effective Ways to Boost Remote Team Collaboration
Focus on Key Areas for Measurement
Identifying key areas for measurement ensures that selected metrics directly impact project success. Therefore, the focus should be on metrics that align with objectives, provide actionable insights, and meet stakeholder expectations. Common key areas include schedule performance for on-time delivery, cost variance for budget control, defect density for quality, and resource utilization for productivity.
Maintain a Balanced Mix of Metrics
To measure project performance effectively, it is important to choose a variety of metrics that cover different aspects of the project. A balanced mix ensures that all key areas, such as cost, quality, Time, resource utilization, and stakeholder satisfaction, are tracked. This helps provide a complete view of project progress and areas that need improvement.
Ensure Measurability and Data Availability
Project metrics should be easy to measure and backed by reliable data. They must be clear, relevant, and based on accurate information to track project progress. Thus, before selecting the metrics, it is important to determine whether the data is readily available from project management tools and can be updated regularly and accurately. This helps in choosing quantifiable project metrics.
Read More: How Can You Make Data-Driven Decisions with Resource Management Software?
As we now know how to select the right project metrics, let’s go through the tips to maximize their impact.
Best Practices for Maximizing the Impact of Project Metrics
Project metrics must be used strategically to achieve maximum success. Following are some tips:
Link Metrics with Business Goals
It is important to link project metrics directly with business goals. This ensures the metrics track project performance and helps determine its contribution to overall business growth. For this, you need to identify core business goals such as timely delivery, customer satisfaction, and profitability and map them to schedule variance, CSAT, or ROI metrics.
Ensure Accurate and Timely Data Collection
It is essential to ensure that accurate data is collected at a scheduled time to maximize the impact of project metrics. Reliable data helps track progress effectively and makes decision-making easier. Moreover, leveraging efficient tools and processes for data collection ensures the metrics are accurate and effectuate better project outcomes.
Align Metrics with Stakeholders’ Expectations
Project metrics must align with stakeholders’ expectations to maintain transparency and trust. By using relevant metrics, project managers can keep stakeholders informed about progress and performance. This helps manage stakeholder expectations effectively and ensures sustained engagement throughout the project lifecycle.
Read More: What is Project Lifecycle and How to Get it Right?
Set Benchmarks for Continuous Improvement
Establishing benchmarks helps evaluate whether a project’s performance is acceptable or needs improvement. For this, you can compare the current project’s performance with similar past projects to set performance standards. You can also refer to competitors and industry averages to compare your performance with peers and drive continuous improvement.
Regularly Adjust and Review Metrics
Metrics should be adjusted based on feedback from stakeholders and project teams. They should also be re-evaluated based on changes in project scope or external factors. Regular reviews ensure that performance evaluation remains accurate. This also keeps the metrics aligned with changing goals, which leads to better decision-making and project management.
After exploring the best practices, let’s see how resource management software helps track project metrics.
How Can Project Resource Management Software Help Track Project Metrics?
SAVIOM’s next-gen project resource management software offers several features that help track project metrics effectively:
- The tool provides 360-degree visibility of project resources, schedules, and workloads in real-time. It helps managers plan efficiently and keep projects on track.
- The software can also perform resource forecasting to spot future resource demand for pipeline projects. This enables better resource planning and proactive decision-making.
- Using the capacity vs. demand report, project managers can proactively identify resource shortages and excess to fill the gap, preventing last-minute hiring expenses.
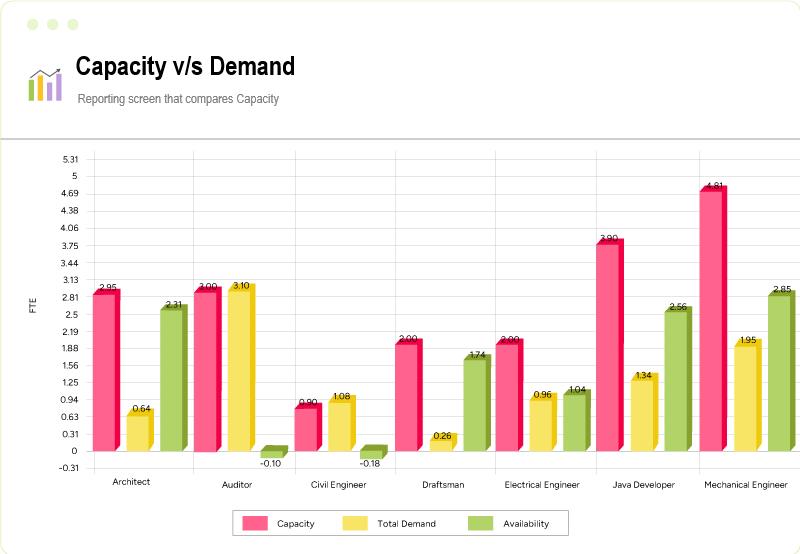
SAVIOM’s Capacity vs. Demand report visually represents resource capacity and demand trends, making it easy to identify shortages.
- The multi-dimensional scheduler helps monitor resource allocation, ensure optimal usage, and track project progress against schedules. This helps prevent double-booking and overallocation of resources.
- Real-time BI reports with color-coded heatmaps provide insights into resource utilization and availability, preventing over/underutilization.
![]()
SAVIOM’s Utilization Tracking Dashboard with color-coded heatmaps provides quick insights into the under/overallocation of resources.
- The Integrated timesheets feature allows managers to track the Time spent on tasks, providing valuable insights into resource productivity.
- With the What-if Analysis Module, managers can simulate and compare scenarios. This aids in developing optimal resource capacity plans and maximizing the potential of existing resources.
Conclusion
Project management metrics can be overwhelming, considering the various constraints in any project. By breaking down the metrics into the above-mentioned categories, it can be easier to analyze the gathered data to gauge project health. They are instrumental in understanding, controlling, and evaluating project outcomes.
What metrics do you evaluate while managing projects?
The Glossary
Read More: Glossary of Resource Workforce Planning, Scheduling and Management