As per Select Software Reviews 2024- “Companies that utilize effective operational metrics have seen a 24% increase in performance compared to their counterparts.” This statistic underscores the critical role of data-driven insights in today’s competitive landscape.
Tracking the performance of your business shouldn’t rely on guesswork or approximations. To thrive and achieve strategic goals, organizations must navigate with clarity and precision. This is where operational metrics come into the picture.
It offers credible data insights that help businesses make informed decisions and develop plans to improve overall functioning. Further, it also helps eliminate redundant activities that spike the cost and seize growth opportunities effectively.
But how do you choose the operational metrics that matter most to your business?
This guide delves into the top 15 operational metrics that every business should monitor, offering insights into how these metrics drive efficiency and help outperform the competition.
Let us begin!

What are Operational Metrics?
Operational metrics, also known as key performance indicators (KPIs), are quantifiable measures that systematically track and evaluate the performance and efficiency of an organization’s daily operations, activities, and outcomes.
By analyzing operational metrics, businesses can identify areas for improvement, optimize resource allocation, and drive continuous operational excellence.
Now, let us see why tracking operational metrics is critical for businesses.
Why is It Important for Businesses to Track Operational Metrics?
Here are the specific reasons why tracking operational metrics or KPIs are of utmost importance for businesses:
Data-Driven Decision Making: Operational metrics provide concrete data that enable leadership to make informed, objective decisions rather than relying on intuition or guesswork.
Performance Optimization: By regularly monitoring key metrics, businesses can identify bottlenecks and areas for improvement, leading to enhanced overall performance and productivity.
Strategic Alignment: Operational metrics help ensure that day-to-day operations align with broader business goals and strategies, facilitating better organizational alignment.
Early Problem Detection: Consistent tracking allows businesses to spot potential issues or negative trends early, enabling proactive problem-solving before minor issues become major setbacks.
Having established the importance of tracking KPIs, let’s explore the standard operational metrics for a business.

15 Key Operational Metrics that Businesses Should Monitor
Here are the 15 operational metrics to keep an eye on and assess the competitive standing of your business.
Financial Metrics
Financial metrics are crucial quantitative indicators that provide insights into a company’s financial health and profitability. They are derived from financial statements such as the balance sheet, income statement, and cash flow statement. It enables businesses to make informed decisions about their operations and financial strategies. Common examples of these metrics include revenue, net income, profit margins, debt-to-asset ratio, and operational expenses.
Now, let us look at these essential KPIs one by one.
Revenue Growth
Revenue growth is a metric that demonstrates the company’s sales growth over a specified period (monthly, quarterly, or annually). This metric is vital for assessing the company’s growth trajectory and market performance. The formula to calculate this metric is:
Revenue Growth Rate (%) = (Current Period Revenue – Previous Period Revenue) / (Previous Period Revenue) x 100
For example, if a company had revenues of $1,000,000 last year and $1,200,000 this year, then (1,200,000−1,000,000) / 1,000,000 × 100
So, Revenue Growth (%) = 20%
Gross Profit Margin
Gross profit margin measures the contribution of actual revenue and the profit achieved before operational costs. It explains how a business manufactures and markets its products; this involves aspects like the pricing strategy, benchmarking, etc. The formula to calculate this metric is:
Gross Profit Margin (%) = (Total revenue – COGS) / (Total Revenue) x 100
Here, COGS is the Cost of Goods Sold
Let’s say a company has a revenue of $500,000 and COGS of $300,000, then (500,000 – 300,000) / (500,000) × 100
Gross Profit Margin (%) = 40%
Net Profit Margin
Net profit margin is a financial ratio used to measure how much net income a company makes for every dollar of revenue. It measures overall profitability after all expenses have been deducted. The formula to calculate this metric is:
Net Profit Margin (%) = (Net Income or Net Profit/ Total Revenue) x 100
For example, if a company has a revenue of $800,000 and a net income of $120,000
Net Profit Margin (%) = (120,000 / 800,000) × 100 = 15%

Debt-to-Asset Ratio
This is a financial metric that measures the proportion of a company’s total assets that are financed by debt. Typically, a lower ratio indicates a more financially stable company, whereas a higher ratio indicates a higher liability. The formula to calculate this metric is:
Debt-to-Asset Ratio = Total Debt / Total Assets
For instance, if a company has total debt of $400,000 and total assets of $1,000,000
Debt-to-Asset Ratio = 400,000 / 1,000,000 = 0.4 or 40%
Operational Expenses
Operational expenses (OpEx) are costs that a business incurs while performing its core functions on a day-to-day basis. These expenses include rent, utilities, salaries, and other costs related to the company’s operation. The formula to calculate this metric is:
Operating Expense Ratio = (Operating Expenses / Total Revenue) X 100
Let’s say XYZ Corporation is a retail company. Here’s a breakdown of its operational expenses and revenue for the year:
- Rent: $60,000
- Salaries: $150,000
- Utilities: $20,000
- Other Operating Expenses: $10,000
- Total Revenue: $500,000
First, we calculate the total operating expenses:
Total Operating Expenses = 60,000+150,000+20,000+10,000 =$240,000
Next, we use the operating expense ratio formula to determine the proportion of revenue spent on operating expenses:
Operating Expense Ratio = (240,000 / 500,000) X 100 = 48%
Human Resource Metrics
Human resource (HR) metrics are quantifiable measures that provide insights into various aspects of resource management, such as recruitment, employee performance, retention, and overall employee satisfaction. Tracking these metrics helps businesses assess skill gaps, improve employee productivity, and achieve the organization’s goals. Common HR Metrics include cost per Hire, time to hire, utilization rate, overtime hours, absenteeism rate, employee net promoter score, etc.
Let’s delve into these important KPIs in detail.
Cost per Hire & Time to Hire
Cost per Hire is the total cost of hiring a new employee, including advertising, recruiting, interviewing, and onboarding costs. This metric helps organizations understand the financial impact of their recruitment processes.
Formula:
Cost per Hire = Total Recruitment Costs / Number of Hires
If a company spends $50,000 on recruitment and hires 25 new employees
Then, Cost per Hire = 50,000 / 25 = $2,000
Time to Hire is the average number of days taken to fill a vacant position from the time the job opening is posted to when the candidate accepts the offer. This metric is crucial for assessing the efficiency of the hiring process.
Formula:
Time to Hire = Total Time to Fill All Positions / No. of Positions Filled
If a company takes a total of 600 days to fill 30 positions
Then, Time to Hire = 600 / 30 = 20 Days
Utilization Rate
The utilization rate is a KPI used to measure the effective usage of resources against their total capacity or available working hours. It helps track resource utilization, employee productivity, and workload distribution. The formula to calculate this metric is:
Utilization Rate (%) = Actual hours worked / Available hours X 100
Let’s calculate the utilization rate for an employee who works 8 hours daily over one week (5 working days).
Available Hours = 8 hours / day × 5 days = 40 hours
Let’s assume the employee worked 35 hours during the week.
Then, Utilization Rate (%) = 35 / 40 X 100 = 87.5%
Read more: How to Track Resource Utilization?
Absenteeism Rate
The absenteeism rate is a metric that helps organizations assess the percentage of unplanned absences of employees from work. It indicates the overall health, employee engagement, and satisfaction level. The formula to calculate this metric is –
Absenteeism Rate (%) = (Total Days of Absence) / (Total Working Days) X 100
Let’s say,
- Number of employees is 10
- Number of working days per month per employee is 20
- Total days of absence for all employees in the month is 5
Total Working Days = No. of employees X No. of working days per month employee = 10 X 20 = 200
Absenteeism Rate (%) = 5 / 200 X 100 = 2.5%
This indicates that 2.5% of the total possible workdays were lost due to employee absences.
Employee Net Promoter Score (eNPS)
Employee Net Promoter Score (eNPS) measures employee loyalty and satisfaction by asking how likely they are to recommend their workplace to others. It is assessed using survey questions on the Likert Scale, and based on the responses, employees are categorized as promoters, passives, and detractors. The formula to calculate this metric is –
eNPS = Percentage of Promoters − Percentage of Detractors
Let’s say a company conducts an eNPS survey among 100 employees with the following results:
- Promoters (score 9-10): 60 employees = 60 / 100 = 60%
- Passives (score 7-8): 25 employees = 25 / 100 = 25%
- Detractors (score 0-6): 15 employees = 15 / 100 = 15%
eNPS = 60% − 15% = 45
The eNPS of 45 indicates a relatively high employee loyalty and satisfaction level, suggesting that most employees are likely to recommend their workplace to others.
Employee Turnover Rate
Employee turnover rate is a metric that measures the rate at which employees leave an organization within a specific period. This rate is crucial for understanding workforce stability and identifying potential issues in employee satisfaction. The formula to calculate this metric is:
Employee Turnover Rate (%) = (No. of Employees Leaving) / (Avg. No. of Employees) X 100
For example:
- Number of employees at the start of the month is 50
- Number of employees at the end of the month is 55
- Number of employees who left during the month is 5
So, the average number of employees = 50+55 / 2 = 52.5
Hence, Employee Turnover Rate (%) = 5 / 52.5 X 100 = 9.52%
The employee turnover rate for the month is approximately 9.52%.
Read more: What is Resource Management? A Comprehensive Guide for All
Marketing Metrics
Marketing metrics are quantifiable values that help businesses track the performance of campaigns, initiatives, and strategies. These values help understand how effective marketing is in targeting the right audience, creating traffic, or making the sale or conversion. Common marketing metrics include conversion rate, customer acquisition cost, cost per click (CPC), return on advertising spend (ROAS), customer lifetime value (CLV), and churn rate.
Let’s dive deep into key marketing metrics.
Customer Acquisition Cost (CAC)
Customer Acquisition Cost (CAC) is a KPI that tracks the average marketing and sales costs required to attract and convert a new customer. It helps forecast and allocate marketing budgets and offers critical insights into customer behavior, preferences, and acquisition trends. The formula to calculate this metric is:
Customer Acquisition Cost (CAC) = Total Cost of Sales & Marketing / Number of Customers Acquired
Example: If a company spends $10,000 on marketing and sales and acquires 100 new customers, then
CAC = 10000 / 100 = $100
Customer Lifetime Value (CLV)
Customer lifetime value (CLV) estimates the total revenue a business expects to generate from a single customer over their relationship. It helps identify customers for targeted retention programs and personalized marketing campaigns. The formula to calculate this metric is:
Customer Lifetime Value (CLV) = Average Purchase Value X Purchase Frequency X Customer Lifespan
For example, for a single customer
Average Purchase Value: $100
Purchase Frequency: 3 times per year
Customer Lifespan: 5 years
So, CLV = 100 X 3 X 5 = $1, 500
Cost Per Click (CPC)
It is a digital marketing metric that determines the total cost an advertiser incurs for every click on the advertisement. Often referred to as pay-per-click (PPC), it defines bidding strategies. Further, by comparing CPC with the revenue generated from clicks, advertisers can calculate the ROI of their advertising campaigns. The formula to calculate this metric is:
Cost Per Click (CPC) = Advertising Campaign Cost / Number of Clicks
Example: If advertising Campaign Cost is $500 & Number of Clicks is 200
Then, CPC = 500 / 200 = $ 2.50 per click
Return on Advertising Spend (ROAS)
It is a marketing metric that determines revenue acquired for each dollar invested in digital advertising. By comparing ROAS, it provides insights into the impact of campaigns, helping businesses to evaluate its performance and return on their investment in advertising. The formula to calculate this metric is:
Return on Advertising Spend (ROAS) = Revenue from Advertising / Cost of Advertising
Example: If revenue gained from advertising is $10,000 & cost of advertising is $2000
Then, ROAS = 10,000 / 2,000 = 5
This means that the business earns $5 in revenue for every dollar spent on advertising.
Churn Rate
Also known as customer churn rate or attrition rate, it refers to the percentage of customers who discontinue their trade with a business over a given period. This is a crucial metric for any organization, especially subscription-based, as it determines revenue streams and business growth capabilities. The formula to calculate this metric is:
Churn Rate = (No. of Customers Lost During a Period / Total No. of Customers at the Beginning of the Period) X 100
Example: If No. of customers lost during the month is 20 & total no. of customers at the beginning of the month is 500
Then, Churn Rate = 200 / 500 X 100 = 4%
This means that 4% of the customer base churned (or discontinued their service) during the month.
Thus, by understanding and effectively utilizing these metrics, businesses can monitor their current status and strategize for sustainable growth and profitability.
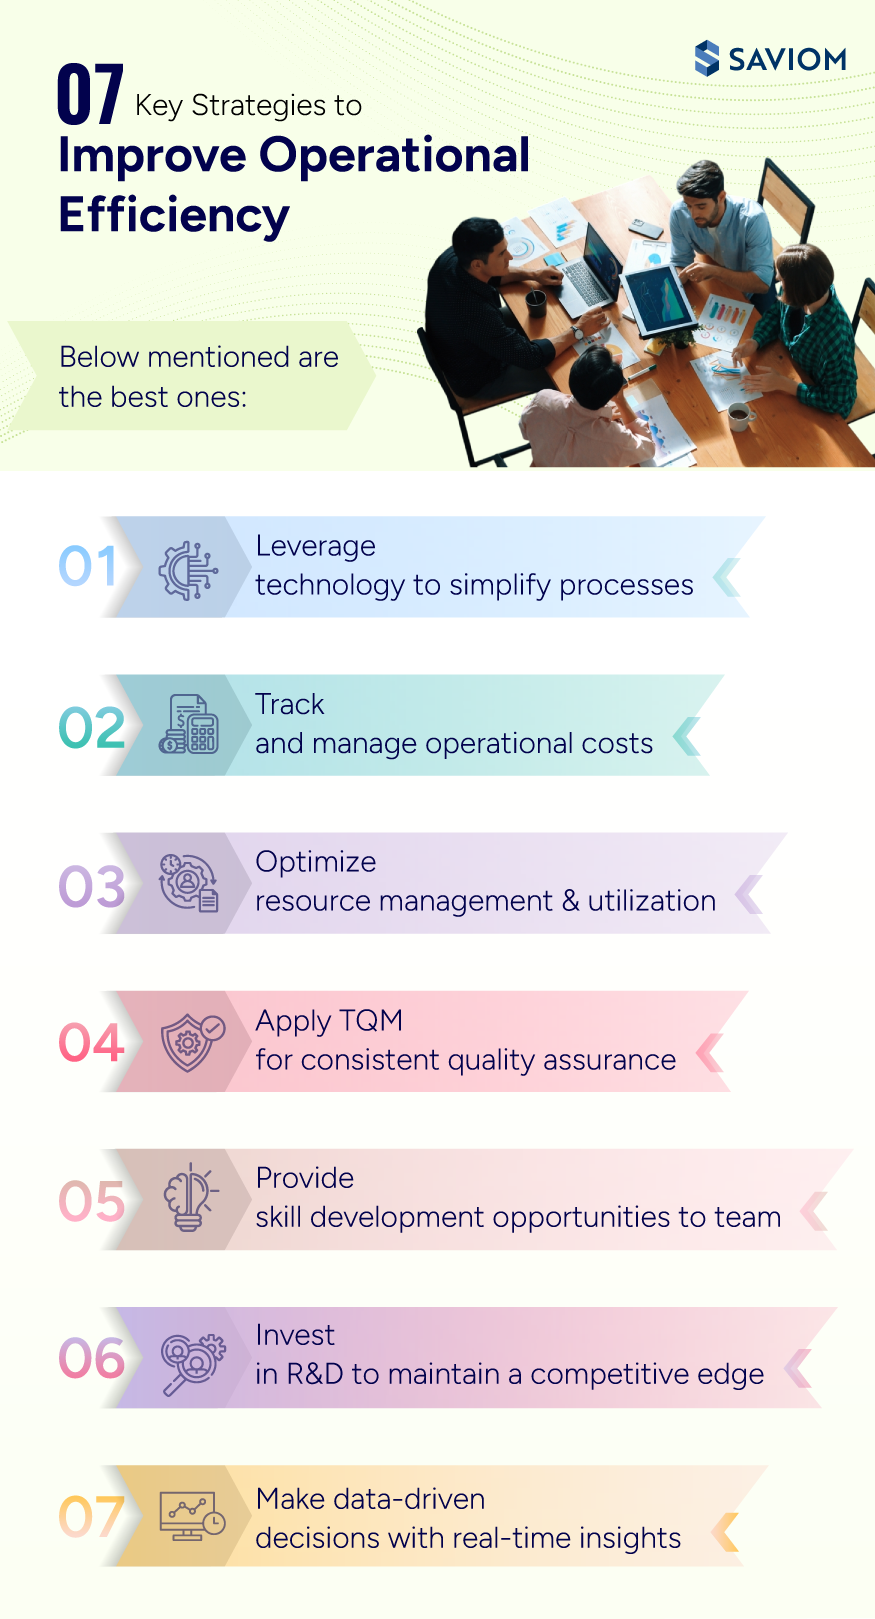
Read more: How to Improve Operational Efficiency in Your Firm?
Expert Tips to Select the Right Operational Efficiency Metrics
Choosing the right operational efficiency metrics is critical for aligning business strategies with measurable outcomes. Here are key expert tips to guide your selection process:
- Select metrics and KPIs that directly align with your business goals and are practical to measure consistently.
- Identify what information project stakeholders find valuable and prioritize metrics that address their interests.
- Use reliable and timely data for metric calculations to avoid inaccuracies, as poor data quality can generate inaccurate results.
- Choose metrics that predict future performance (leading) and reflect past performance (lagging) to create a balanced mix of KPIs.
- Avoid metrics that can easily be manipulated or do not directly impact business objectives, like app downloads, social media followers, etc.
The Glossary
Read more: Glossary of Resource Workforce Planning, Scheduling and Management
The SAVIOM Solution
SAVIOM is undoubtedly the market leader in offering the most powerful and configurable Enterprise Resource Management Solution. Having more than 20 years of experience, this Australian-based MNC has a global presence in over 50 countries. It is also popular with more than 100 customers and helps them to achieve their business goals. SAVIOM also has products for project portfolio management, professional service automation, and workforce planning software which can be easily customized per business requirements.